I first visited Cedar Key in 2005, during early research on Rosewood. A lot has changed since then. Some of this is the normal ebb and flow of a coastal town, some of it from increasing tourism, and some from the growing threat of sea level rise and storm surge. Much of my research uses digital technologies to interpret cultural resources. These same technologies can support other forms of analysis. This post explores preliminary simulation work regarding the geophysical processes associated with storm surge, and specifically how this threatens Cedar Key’s archaeological and historical resources.
.
The first step centers on predicting storm surge. Many researchers continue to rely on bathtub models, which represents the flood level as a flat surface across an area. This fails to take into account local landforms or the characteristics of water moving across an area. In other words, it treats the Earth’s surface like a bathtub, with water slowly filling up an area. These models are of limited use in planning for hurricanes and storm surge, which interact in complex ways with local landforms (e.g., bathymetry).
The National Oceanic and Atmospheric Association (NOAA) has a better model. This Sea, Lake, and Overland Surge from Hurricanes (SLOSH) model estimates storm surge heights resulting from historical, hypothetical, or predicted hurricanes by taking into account the atmospheric pressure, size, forward speed, and track data of hurricanes as well as local landforms. NOAA even provides a convenient program called SLOSH Display to estimate surge for different hurricanes. NOAA estimates the model is accurate to within 20%.
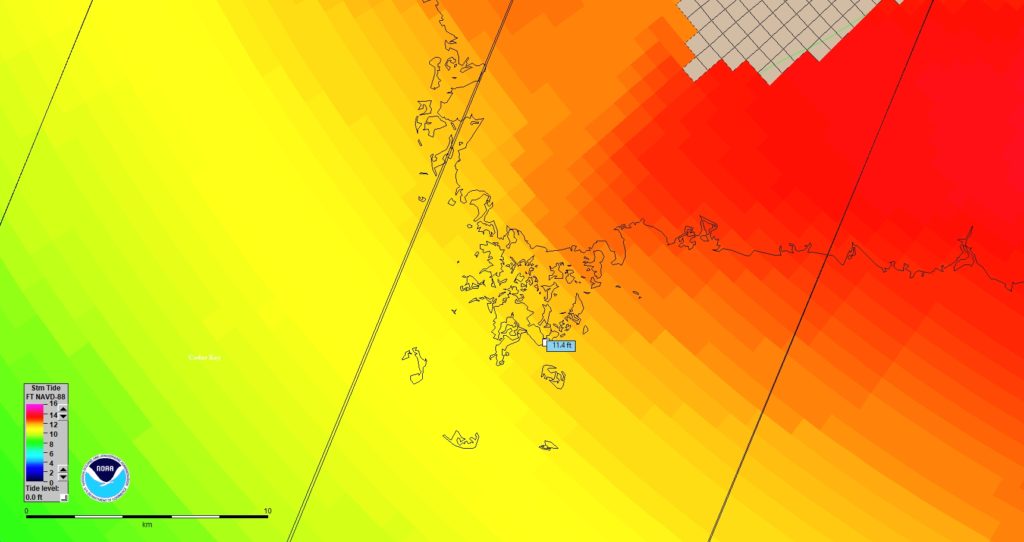
The results of the SLOSH model can be exported to a GIS file. A few tweaks produces a useful visualization. The following graphic is the result of (1) projecting the exported polygon data into a coordinate system matching a digital elevation model (DEM) of Cedar Key (derived from LiDAR data), (2) converting the polygon to a raster, and (3) using raster math to compare/subtract the elevation data from the predicted storm surge. The resulting image indicates which areas will be inundated, and by how much.
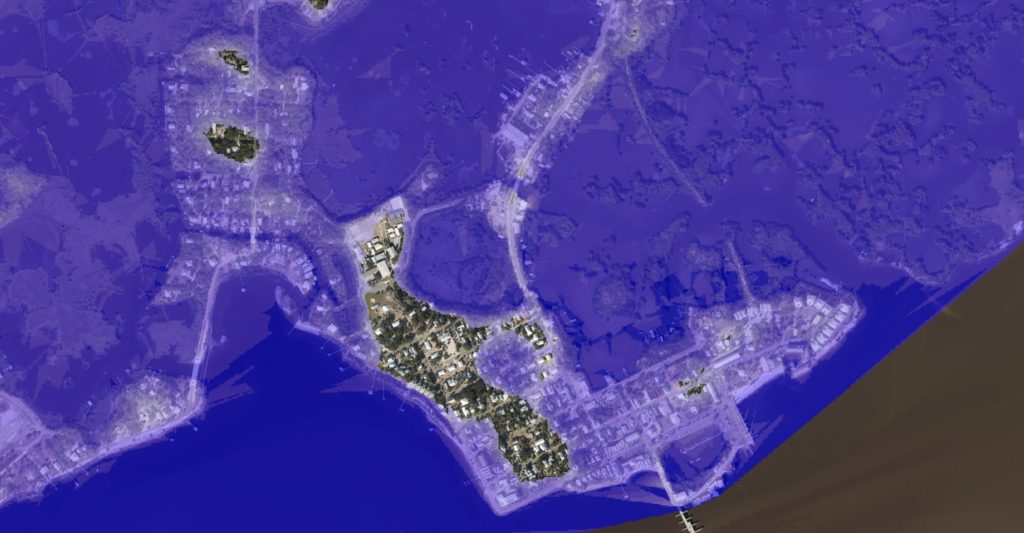
The above analysis refines simulations of surge waters through Cedar Key, and not just today but historically as well. Historical data can be overlaid on historical aerials. For added realism, we can use historical maps like Sanborn fire insurance maps to rapidly prototype a reconstructed, historical Cedar Key. The following images have approximate building footprints from 1920.
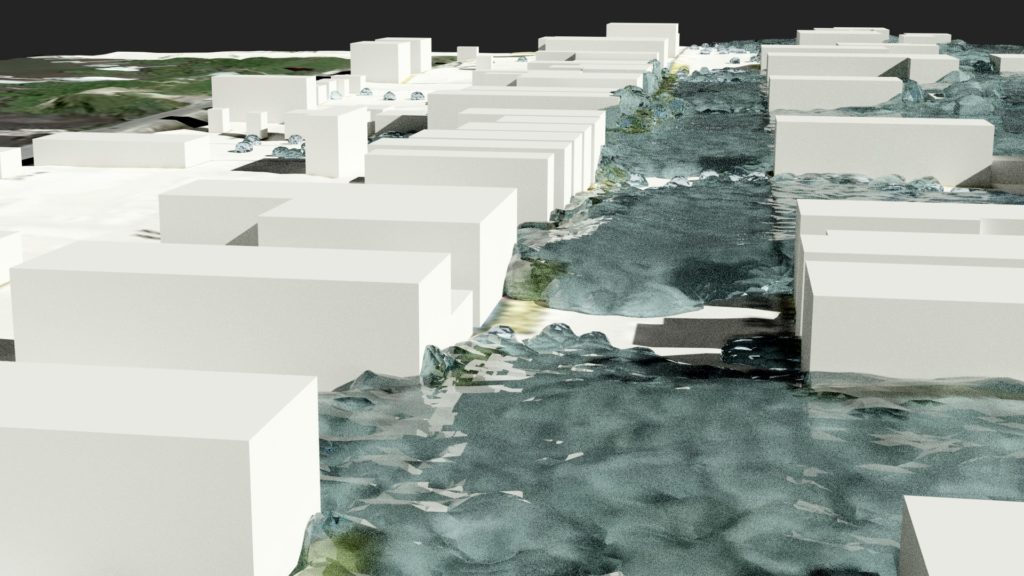
Open source (free) programs are used to reconstruct Cedar Key and simulate storm surge. Blender, with the Flip Fluids add-on provides a rapid method for blocking out Cedar Key and simulating how surge waters might move through a portion of the town. Preliminary results are choppy to cut down on computing time (hours instead of days or weeks!). One consequence of this is the water is modeled as large particles. This gives the impression of large water drops, and makes the model resemble a physical miniature. Still, it proves useful for watching how water moves through the town.
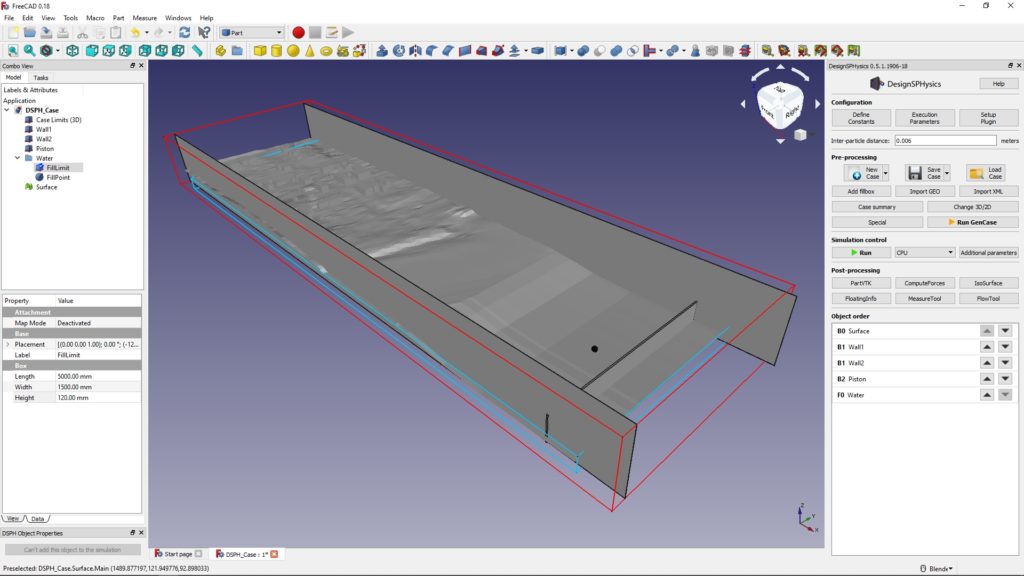
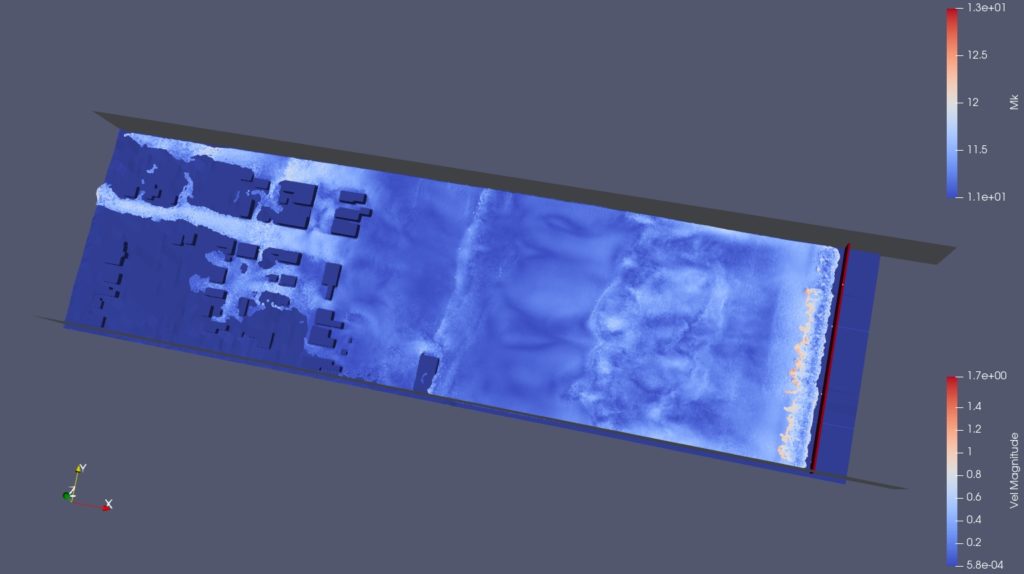
The above is not a scientific simulation. For this we can turn to DualSPHysics, another open source program that models hydrodynamic forces with smoothed physics. This uses some of the same information as the Blender-based simulation, specifically the LiDAR-derived DEM, but there is more control over the simulation. The initial parameters for DualSPHysics are set up using FreeCAD. I’m able to fine tune things like wave height and period.
The simulation is exported to Paraview, an open source data visualization application. This provides even more control over the simulation.
Although DualSPHysics and Paraview can produce compelling visualizations. Exporting the results to Blender produces additional realism.
.
This preliminary work will support several projects. This includes a collaborative project with the Cedar Key Historical Society to create a public experience exploring storm surge inside a VR reconstruction of Cedar Key. Imagine ‘stepping’ into a virtual reconstruction of an historical Cedar Key, then selecting and viewing different storm surges moving through the town (and around the user!). This provides response to the challenge of keeping events like hurricanes more present, something that living memory often fails to do. The ideas animating this work are partly drawn from my growing interest in disaster anthropology, and the role that social processes play in framing and forgetting past disasters, social vulnerability, and risk.
Note: this post was originally located at www.gonzaleztennant.net. I’ll be updating this for projects running in 2020-2021 and beyond. Stay tuned!