I am teaching Disaster Anthropology during the spring semester of 2022 (January – May). This is the third time teaching the course at UCF, which examines the important part ethnographers and archaeologists play in disaster management, planning, and response. I first offered the course in 2012 at Monmouth University as a response to Hurricane Sandy. In preparation for this semester, I took a quick hike to an area inundated during Hurricane Irma (September 2017) to see what remains nearly 5 years later. In addition, I used open source software to examine satellite imagery to learn more about these impacts. This post is a brief summary of that work.

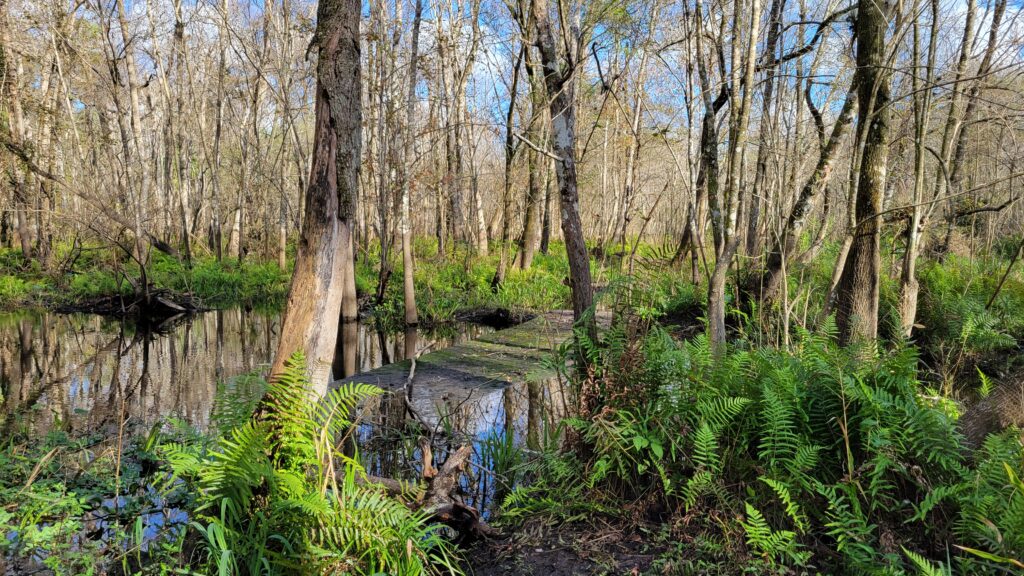
I took a couple of hours to hike the trails at Spring Hammock Preserve, an area bordering Lake Jesup. Soldier Creek Cove on the topo above is the western portion of this lake. Many of the trials and boardwalks remain closed as of January 2022. You can see some of this below.
Seeing the persistent damage, I decided to have a look at satellite imagery for the area. I used Sentinel-2 imagery. In brief, satellite imagery like this is composed of different bands which measure different wavelengths of energy. Combining different bands produces various forms of remotely sensed imagery. You can learn to process this imagery by following my tutorial on YouTube.
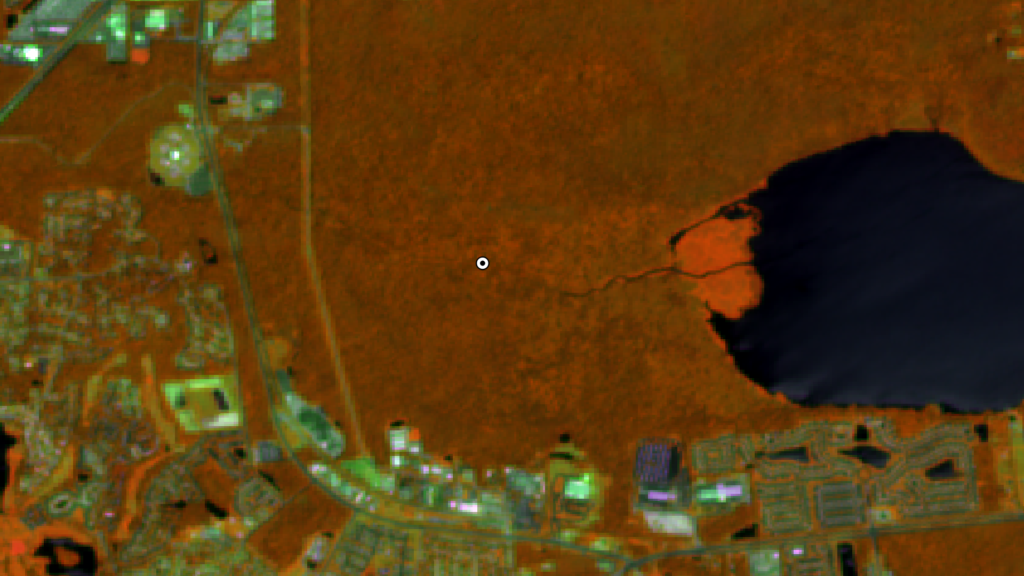
The first image is from July 28, 2017 or roughly 1.5 months prior to Hurricane Irma hitting the area. While there is imagery closer to September, most of it is obscured by cloud cover. The following image combines bands 8-11-4 to produce Water/Land imagery. In this type of combination, land appears in shades of orange and green, and water appears in shades of blue. The following image shows a lot of water and waterlogged land, but also a lot of dry land (reds and oranges).
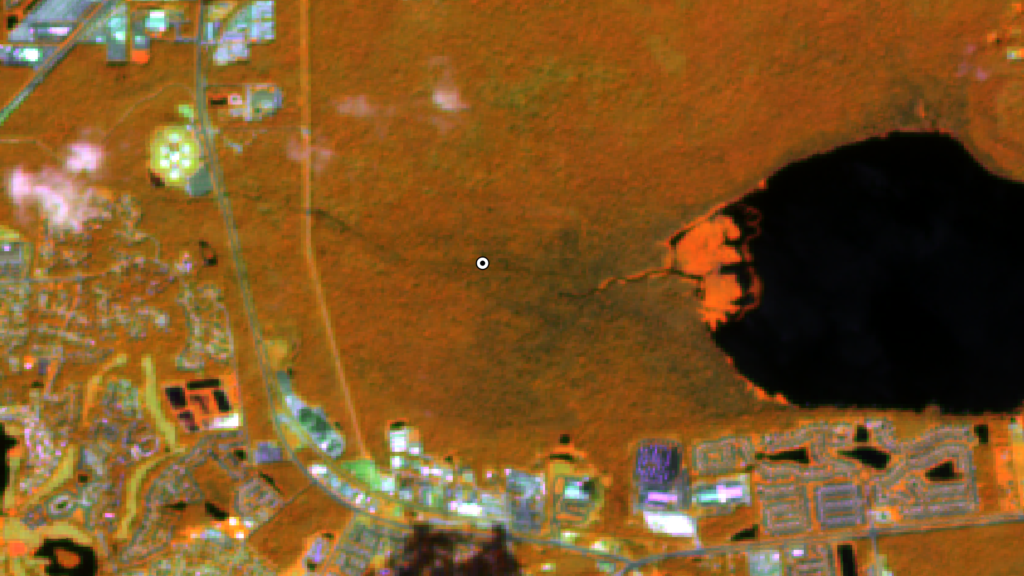
The next image is from approximately two weeks following Hurricane Irma. You will note substantial amounts of water remain in the area represented by the deeper blue/green areas around Soldier Creek. Also, the fan entering Lake Jesup has been substantially altered.
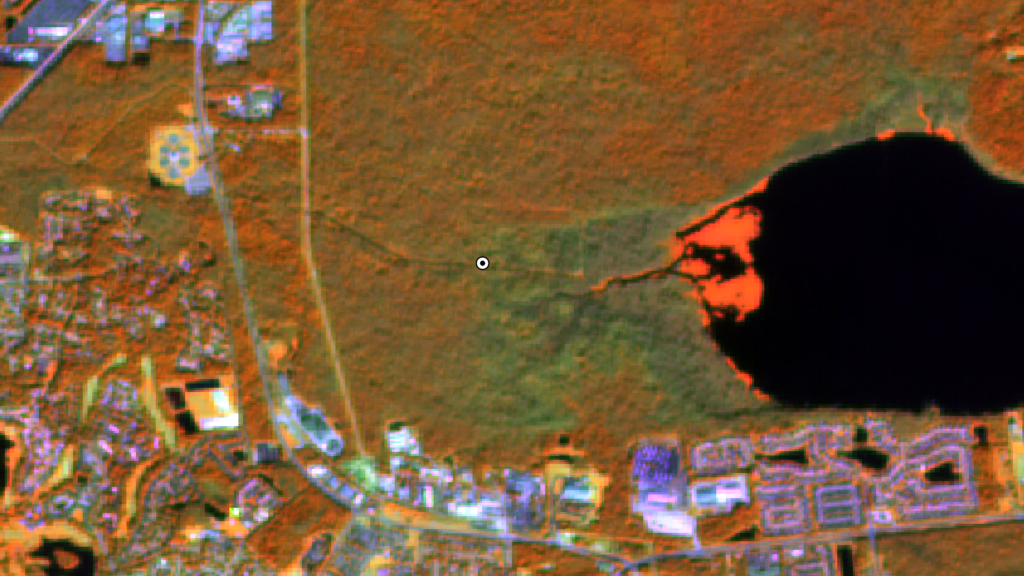
Compare the above two images with the following Land/Water combination from December 29, 2021. The landscape has been permanently altered, with water remaining in the areas around Soldier Creek in ways that it did not previously. Note: the slight variations in brightness and contrast between these three images are due to variations within the satellite position and atmosphere for each date.
As you may have noticed in the above photograph, the area remains impacted today. Recent photos of the area show how inundated the area was during Hurricane Irma. For instance, the following image shows water lines on trees that remain on January 1, 2022. In many areas, water reached heights of 5 feet or greater!
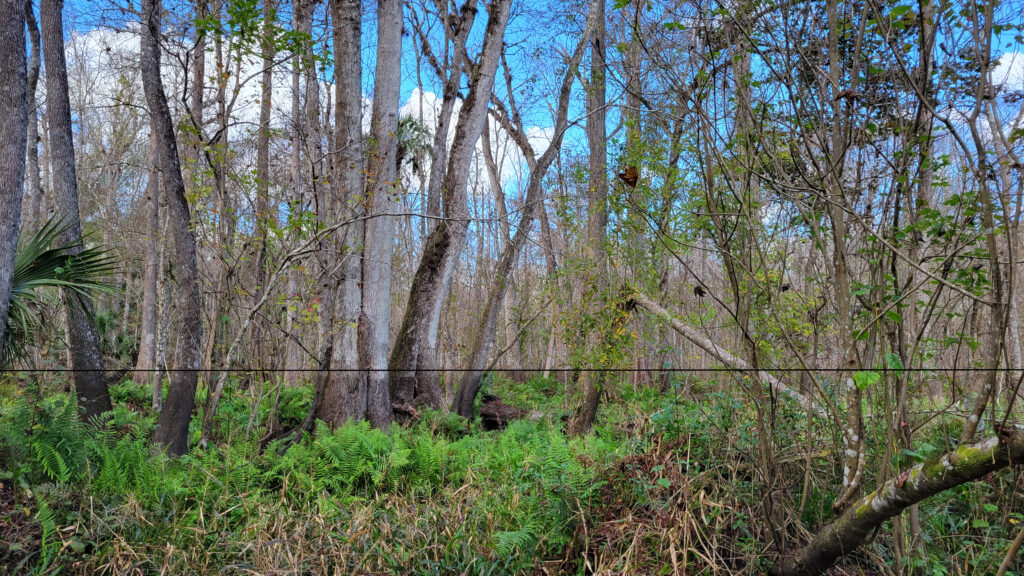
Of course, the ever-present water line pictured above steadily rose on trees as I hiked eastward from the parking lot towards Lake Jesup. It is a visible reminder of the long-term impacts of these events. That’s it, a quick post about combining field recon with remote sensing to produce a quick environmental history. Thanks for reading!